
I love information, but like most people, I process information faster with pictures, graphs, graphics, charts, and meaningful images.

About ten years ago I came across the work of Edward Tufte, an American statistician and professor emeritus of political science, statistics, and computer science at Yale University. He is also an artist (his Feynman diagram sculptures are interesting), and an expert in the presentation of informational graphics (think charts and diagrams). His books Visual Explanations, The Visual Display of Quantitative Information (the first of his books I read), Envisioning Information, and Beautiful Evidence bring together science and art in a way that generates what we call visual information.

Everyone talks about information, but what exactly is information?
Information is an abstract concept, a notion or idea we intuit. What we intuit could be a theme embodied in a design or a concept through which we mentally travel. As we do, we focus on the data points and associate meaningful images to represent those points.

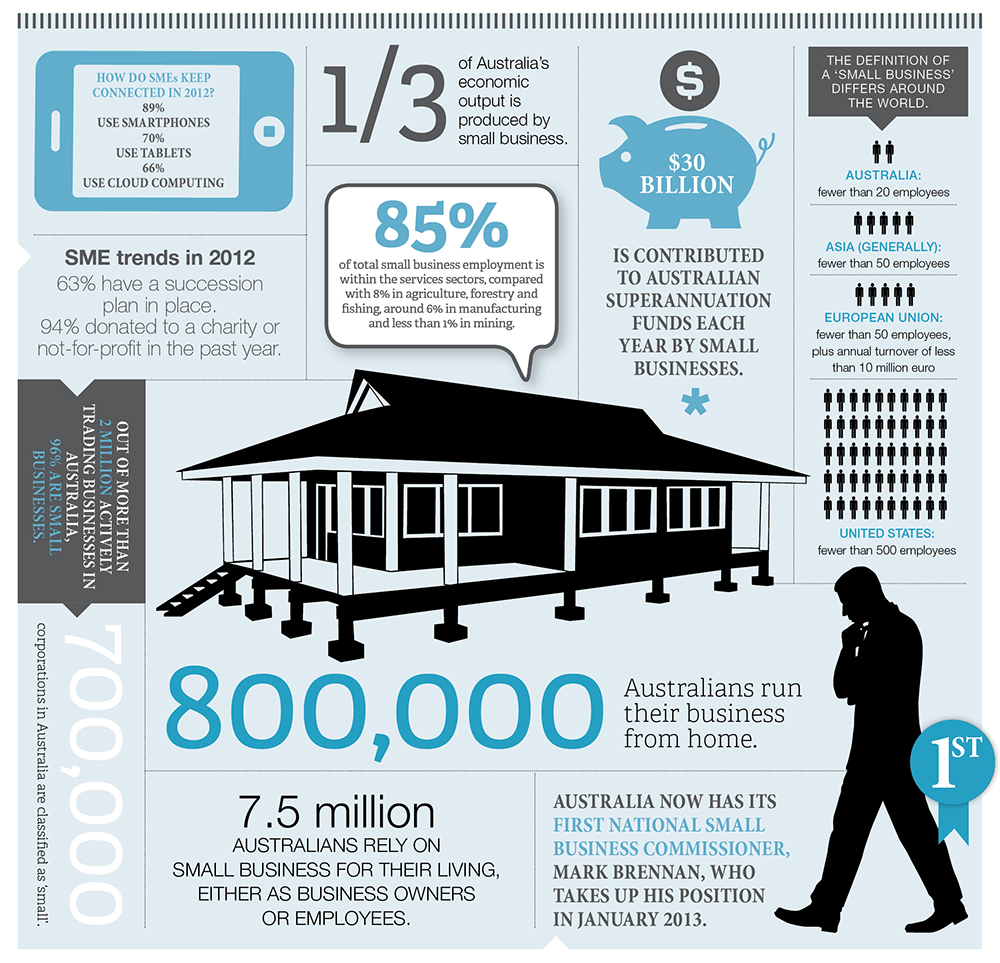
Take for example the above infographic which only provides us with numbers and a small iconographic representation of a human being in a specific occupation or stage of life.
But we don't just read this infographic, we visualize the data it provides. We think of little kids playing in the park and of the people working at our favorite restaurants. We're probably all surprised that there are 1.4 billion people working in agriculture around the world. Next we mentally scan the list of industrial jobs and think about what people do in those jobs. We visualize baby boomers and senior citizens, and some of us are concerned about all the unemployed people (and their families) in the world. Then we imagine what life might be like if we forge our own path, make our own mark on the world ... Steve Jobs, Bill Gates, Richard Branson, Walt Disney, Sam Walton, Larry Page ...


When data is presented in meaningful terms, we contribute to the visual experience with our own knowledge of the world. In other words we interact with the data.
Of all the words in the two above paragraphs 'we interact with the data' stood out to our brains because of the way space is represented in the brain.
Bold text makes a greater impression than ordinary text.

The more information we produce, the more visual our language will become. When we want to compare and contrast information, the fastest way to process this information is to compare the data side by side. No one has time to waste reading through countless pages of consumer reports.


Graphic information is only as sound as the data supporting it, and is often times presented with a bias. Companies wanting you to buy one product over the other will highlight certain information and leave other information out.
Processing, analyzing and communicating data presents a variety of ethical and analytical challenges. Data scientists admit that data visualization is both an art and a science. Given the rate we are generating "Big Data" (data created by internet activity and an expanding number of sensors in the environment, such as satellites and traffic cameras), making information more meaningful and more easily digested becomes one of our next greatest challenges.
The way in which we present information or design it should support the analytical task, showing the comparison or causality.
In this respect, graphic displays should:
- show the data
- induce the viewer to think about the substance rather than about methodology, graphic deisgn, the technology of the graphic production or something else
- avoid distorting what the data has to say
- present many numbers in a small space
- make large data sets coherent
- encourage the eye to compare different pieces of data
- reveal the data at several levels of detail, from a broad overview to the fine structure
- serve a reasonably clear purpose: description, exploration, tabulation or decoration
- be closely integrated with the statistical and verbal descriptions of a data set

Essentially graphics reveal data.
Information can also be presented in humorous ways. The more engaging the graphic, the higher the likelihood someone will invest the time to read it.

When information is presented in very simple terms such as in this happiness flow chart, it is almost impossible not to read it. Our brains instantly scan the words, while the interrelatedness needs to be conceptualized.

But data still has to be abstracted in some schematic form. Its attributes and variables have to be extracted and transformed into units of information. As with any form of communication, the intention of the message and the audience to whom it is delivered are key factors.
The primary goal of presenting information with graphics, plots, information graphics, tables, and charts is to communication information clearly and efficiently. Visualizing information is something we do naturally. Visuals that speed up the process help us make faster decisions. We also remember this information longer. Even a familiar quote is more memorable when we see it presented in a more visually engaging format.

In a nutshell ...

We can more easily distinguish differences in line length, shape orientation, and color (hue) without significant processing effort; these pre-attentive attributes are what save us time and effort in attentive processing.
Effective graphics take advantage of pre-attentive processing and the attributes that strengthen this processing.

No comments:
Post a Comment